Today I bring you a quite nice web application to explore science and relation between different sciences.

This web has an amazing and interesting tools inside.
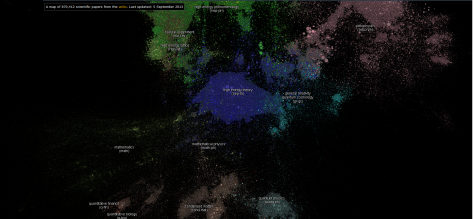
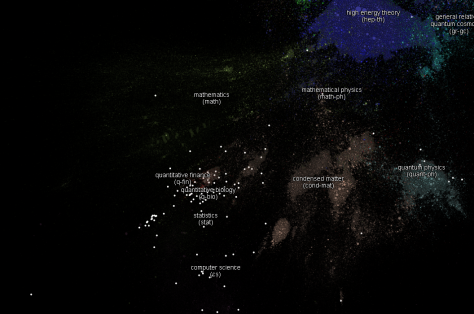
The first of it are the sciences maps (go to the web to see more). This maps show you how different articles from different sciences cite each others.
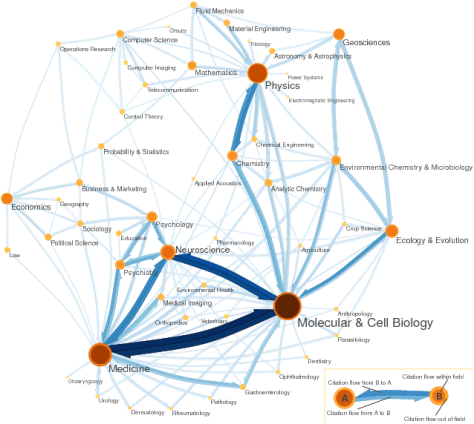
I think some of my complex networks colleages will find interesting to have the data to perform some analisis. For example, if this network has power law in his degree distribution, it means that it is resistant to deleting some nodes randomly. In real life, that means that science will continue even if for a certain time there is no new improvements in some areas (deleting some of the nodes).
I wish to have a look to the info and plot the degree distribution, but unfortunately, to get the raw data one has to pay to Thomson Reuters.
Other tool inside this web is the citation paterns.
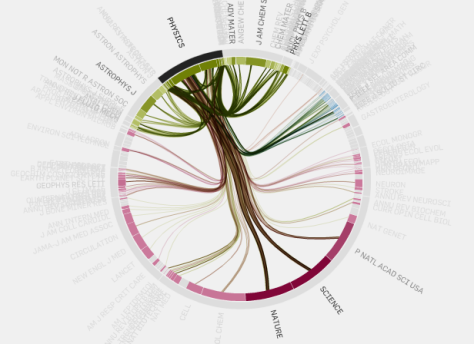
This allows you to see where the citations came from to an specific topic and (with colors) which was the journal that publish it.
Those are just two examples of the things inside the web. There is a lot of more kind of plots and info. Take a break and check them out. Without any kind of doubt, playing around a little bit with this web is interesting to understand the relations of your interests with other areas. And if you are looking for some especific information, this will be a good way of knowing where to find that information.
And as a final…
EigenFACTOR is close related to this other web:
This webpage is basically a big JAVA application to plot your networks and make them look as cool as eigenFACTOR ones.
As an example, I’m going to show you how to plot the network of Protein-protein interaction in budding yeast. I know, I know, there more much more interesting, but this one is free, so don’t blame at me. (Thanks to Max Stirner for helping me a little bit with this part).
Step 1. Get the data of the network. It must be in Pajek format. So you can just type “pajek network download” in google and you will get lots of examples. In my case, I found this one:
http://vlado.fmf.uni-lj.si/pub/networks/data/bio/Yeast/Yeast.htm
You can choose another one if you wish. Here you can find links to the most popular data sets for networks. Most of them in Pajek format or with instructions to turn them into pajek.
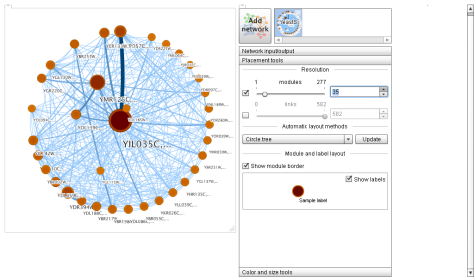
Step 2. Once downloaded the data, go back to Mapequation, to section “Mapgenerator“.
Step 3. In the lower part of the page you have a short tutorial of how to use it. For now, just click on Load network>Open File. This one I’m using is undirected. Look for the files you downloaded. In my case YeastS.net.
Step 4. Wait until it is loaded, and then click on calculate clusters. As you can see, the result is a little bit… Well, not impresive… but go to next step!
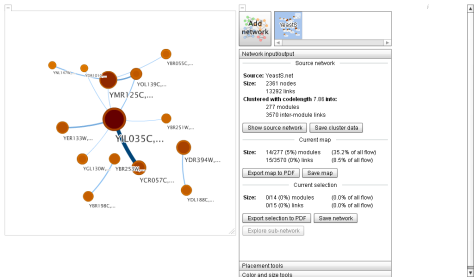
Step 5. To change the number of nodes displayed, go to Placement tools and play with the parameters. (In my case, my poor netbook can only show 35 nodes, above that it starts to suffer). And voilá:
Using this kind of tools researchers can look for missing relations (for example a part of the network has a low degree distribution, below the average, suggesting undiscovered relations that must be discovered and added to the graph to make it complete).
Hope you enjoy this resources and if you wish to look for more knowledge, don’t forget to visit the Barabási Lab.

 Giant microbes is an online shop for those who love biology.
 Some of them are quite unpractical, but for sure all of them are the perfect gift to learn about biology.
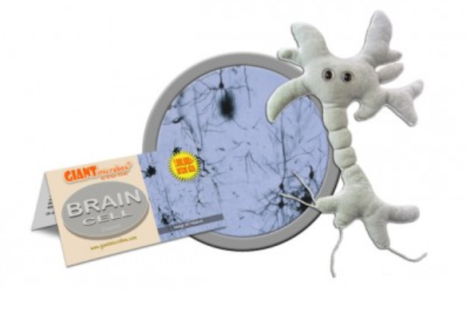 Also, if somebody has just recovered from that particular illness, they are perfect.
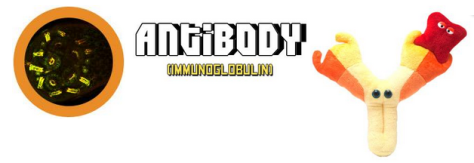 They can be a good way of making a boring class into something funny and help people learn.