Tag Archives: animated fractal
ASFOW
Today M.E. (Mysterious Explorer) send to me this.
ASFOW
Today M.E. (Mysterious Explorer) send to me this.

Hi-Tech for Halloween
I was preparing my costume for this Halloween when I came across this shop Morphcostumes.
![]()
What is new here? Well, judge by yourselves.
Neko Time!!! =^_^= Dresden Asisi Panometer
Welcome to another Neko Adventure!
Last week I have been on Dresden, Germany. I went for a scientific conference and I explore a little bit the city… and guess what I found?

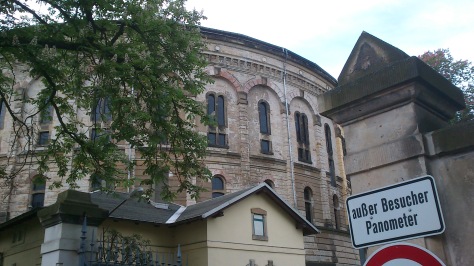
Panorama! Actually, this time I didn’t make the Panorama, it was already there. I visited the Asisi Panometer in Dresden.
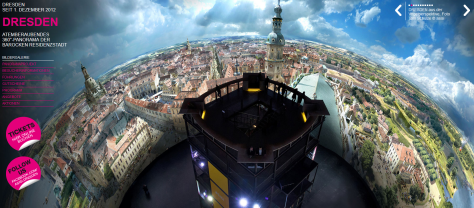
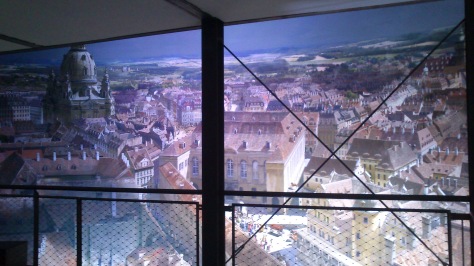
The Panometer is an exposition where a massive painting arrange in 360º around a tower allows you to see the painting as inside of it. In other words, it’s Google street view handmade.
It seems that Asisi has been doing this exposition for a while, Berlin, Leipzig, Dresden, Everest, Rome… All the time bringing a place to life, either an actual view or an ancient one.
The one in Dresden offers a magnificent view of the city as it was in 1756, with all the people going around in horses, with traders in the streets, boats, farms… all the small details of the painting offer a story to the visitor.
If you have the chance to visit it, don’t hesitate, GO! Or maybe one of the others. I want to visit the one about Rome, it promise to be amazing.
If you want to take a look and see how it looks, I took a panorama for you (click on the image to go).

(Of course, I added this place to the Atlas Obscura ).
That’s all
.
.
.
.
.
.
.
What? Want more? Isn’t enough? Ba!
.
.
.
.
.
.
.
Ok, here it is
Neko Time!!! =^_^= matthen
Last week I spend some days in Cambridge performing some experiments at the university,l and as always happens when I go to Cambridge, I learn something new.
This time I came across Matt Henderson blog.

Matt has a mathematics degree by Cambridge University, and he is now working on his PhD on statistical dialogue systems.
He is an unstoppable explorer. His blog is full of experiments and nice mathematical simulations. And here I want to show you which are the ones I like the most. Who knows, maybe a collaboration between us could be possible in the future.
So, here they are.
Basically, if you have particles moving randomly and they are able to become added to a seed, then these random patterns appear. They are close related to chemical reactions and electrical transport. Nice post, with code, and a link to.. Agregation images by Andy Lomas.

Gingerbreadman is a chaotic map. Basically, you select random points in the plane and using very simple equations, you transform the points into new ones. If you repeat it enough times, a figure appears that looks like a Gingerbreadman. And I like this one because I also explore it myself. Remember this?

Iterated function systems is a technique to build fractals using transformations of points. It’s similar to the Gingerbreadman map, but with a set of equations that alternate randomly. And I also explore it! Remember the 100 posts post?
This was the post that bring me to the blog. The double pendulum is an example of a quite simple chaotic system, it’s only two pendulums linked. In the image on top we can see 2 double pendulums, what the animation want to show is that quite similar initial conditions can evolve into very different evolutions. (I’m working in a nice post about this, but I’m not telling anything more now).

This is an applet to play with iterated functions systems. This one uses the geometrical approach for defining the functions used for performing the iteration. I like it, is quite good. Unfortunately, it’s difficult to repeat successfully patterns.
Create GIF animations with Mathematica.
I don’t like Mathematica, I prefer Matlab or Python, but… who knows, this could be useful.
I saw this effect long ago in a book. I like it. I never had enough time to make anything. But here you can see how it works.
In this post what he wants to show is the importance of designing of buildings. Basically, a good design can help to build a museum where you can visit exactly once each room without crossing with other visitors. Or… if it is a mall, how to design it to make people walk several times into the same point (increasing the showing of that particular shop).
The film doesn’t belongs to the blog, but is so amazing…
I like this one, is my first sound illusion. Basically, you feel like the scale is getting higher, but it is not.
A Tautochrone (or Brachistochrone if you focus on other property) is a curve where no matter you put a ball on it, it always takes the same time to get to the botom point. I saw many times the Brachistochrone and never realize that it also has this property. I can think of quite funny experiments now for it.
f[x_] := Print[StringJoin[x, FromCharacterCode[{91, 34}],x,FromCharacterCode[{34, 93}]]];
f[“f[x_]:=Print[StringJoin[x,FromCharacterCode[{91, 34}],x,FromCharacterCode[{34, 93}]]];f”]
A quine is a piece of code which is able to print itself. I heard about it before, but it’s the first time I saw one for Mathematica.
And thats all. If you want more, visit his blog. Hope you like it!
NetLogo 01
To be prepared for a post about the Santa -Fe institute, I need to introduce you to this program.

NetLogo is a program to simulate agent-based models using object-oriented programming. What that mean?
A model based on agents is a model of a system where you suppose the system formed by different entities called agents. A model of a solid made by atoms si an example where the agents are the atoms. Is that all? No. An agent-based model must include agents and rules to interact between them. And mos important, the properties of the system must arise as a collective property of the agents. For example, in the solid, the net magnetization must arise as the interaction between the spins of the individual atoms.
Ok, seems like agent oriented models is more or lees what we have been doing for a long time in some simulations. Why so much noise about this program? Because the object-oriented programming is the way of programming agent-based simulations. What do I mean with that? You can program anything with any language (there is a theorem that grants that), but depending on the task and the language used, the problem became easy or a complete hell. So using object-oriented programming is the easy way of dealing with agent-oriented models.
Enough.
Go to the webpage, hit download, fill the questionnaire (if you wish you don’t need to fill it), and download and install the program.
Now that you did that, run the program for first time,k it will look something like this.
![]()
From here, you are only interested in “Interface” and “code”. Interface is where things happen and where you put buttons and sliders to control your simulation. And also, where the graphics and plots will appear. The code view is where you actually write the code for your simulation.
To start with something easy, go to File>Models Library and we are going to choose…. Chemistry and Physics>Ising.
![]()
The Ising model is a classical model for magnetism. In this case, each agent is going to behave like a magnet which can be pointing up or down (dark or bright). The agents randomly will be allowed to change their orientation if that minimises their potential energy respects it’s neighbours. And sometimes, randomly also, they will go into a bad configuration. The principal parameter on this model is temperature. Temperature determines the amount of bad random changes. And the interesting result is that below a certain temperature, the system evolves towards all the agents in the same state, while over that temperature the agents in one state equal the agents in the other state. And that is a good example about magnetic domain formation and Curie temperature.
To run the simulation, push setup-random to initialise the variables and then go to run it.
![]()
Hmmm but this representation of the results is not funny. To make it more funny, we are going to plot the average spin versus temperature. To do it, right click on the plot and hit edit. And now we only need to remove the pen that draws the horizontal line and change ticks for temperature. So now, each time the plot updates with a new point, the new point is going to have temperature as x and average spin as y. You can also change the axis limits to fit better the new data.
![]() And now, just change the plotting-interval to maximum, hit setup-random, go…. and ramp up and down the temperature several times slowly (there is a slider on top to accelerate the simulation).
And now, just change the plotting-interval to maximum, hit setup-random, go…. and ramp up and down the temperature several times slowly (there is a slider on top to accelerate the simulation).
![]()
That process is the equivalent to have a magnetic material and cool it down and heat it up several times. You are going to see that sometimes, when you cool it down, you end with a magnetization different from zero, maybe 1. But above some temperature, the magnetization it’s always zero. Something like this.
![]()
That transition temperature is what we call Curie temperature.
Ok, so now with a first example.
Step 1: Help>Look up dictionary This will help you quite a lot.
Step 2: File>New.
Step 3: Create a SETUP button. Right click on a white area and add a button. On the window that appears, writet in the commands area SETUP. And hit ok.
Setp 4 Create a GO button. Rigth click on a white area and add a button. On the window that appears, writet in the commands area GO, select forever. And hit ok.
It will look something like this.
![]()
This buttons will execute the scripts located in the CODE area with the names SETUP and GO.
Setp 5 Switch to code area and write the commands to SETUP and GO
Setp 6 We write for setup these lines to create 160 turtles (turtle is the generic name for the agents).
to SETUP
  clear-all
  ;; create 160 turtles at the center pointing at diferent random angles and positions
  ;; with different colors
  create-turtles 160
  ask turtles [
    setxy random-xcor random-ycor]
  ;; ticks are used to measure time, how many interactions has pased
  reset-ticks
  tick
end
Setp 7 In each iteration step we ask turtles with same colors to move closer together.
to GO
  ask turtles [
    ;; In order, each turtle is asked to do something
    ;; In this example we pick a random turtle and compare color with the actual turtle
    let a one-of turtles
    ;; If the color is the same, as the current one, the current one moves towards that turtle.
  if   color =  [color ] of a [face a fd 1]
  ]
   tick
end
All together will look like this.
![]()
Setp 8 With all the steps sccomplished, run the simulation.
![]()
Like it? Want more? Ok, one more. I show you how is going my random forest on NetLogo. (Remember my version on OpenProcessing?)

L-Systems and Penrose P3 in Inkscape
Remember the Post about Penrose designs? Funny? (Review it, if you didn’t watch it, because it was beautiful). So, today I’m going to show you how you can do some Penrose tilings and maybe one or 2 things about L-Systems (Lindenmayer system).
What a L-System is? Well… without words, these are examples of L-Systems.
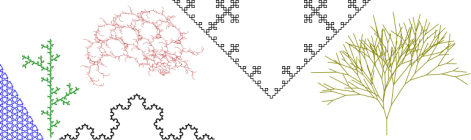
With words… really you don’t want words… See wikipedia definition of L-System and come back after “words”.
The basic concept of an L-system is drawing a figure using a rule and repeat this rule in each part of the figure again and again.
For example, we can make the Koch curve in this way describing it as an L-System instead of a Fractal line.
Using common words, the way of doing the Koch curve as a L-System is this. My first draw, my Axiom will be a horizontal line. And my rules says that in each iteartion I will divide my line into 3 lines. The two on the edges will remain, while the one in the middle I use it to make an equilateral triangle. The new lines of the triangle remains, the middle line not.

Now that it is a L-System, there is a very compact way of describing this system using grammars.
Suppose we write F for a straight line, + to a 60º turn after a straight line, and – to a –60º turn after a strigh line. Then we say that for the Koch line we have
Axiom: F (We initiate the System drwaing a straight line).
Constants: + , – (This are the operation we can apply over our line, basically, we can rotate it for example and then the constant are reffered as angles).
Rules: F->F+F–F+F (In each iteration we susbtitute the line F for other 4 straight lines, drwaing the first one along the original, the next one after turning 60º, the third after -120º turn and the last one turning 60º and liying again over the original one).
Very funny… let’s see if we get the idea trying to reproduce the Cesaro-Koch Fractal.
This is the process to do the fractal.

So, what is the grammar?
Axiom:
  F
Rules:
  F=F+F--F+F;
Angle+: 85
Angle-: 85
Basically it’s the same as Koch curve changing the angles!
Ok, let’s go for something a little bit more complex (I’m not expert in L-Systems, actually I´m learning at the same time i try to explain this).
For the next example I’m going to use “The Turtle”. The turtle method consists in viasualizing a small turtle following the rule and having a pencil attached at his back (the pencil can be lifted or down).
Suppose this system:

Which has.
Axiom:
  F
Rules:
  F=+F+F-F-F+F+F+F-F-F+F;
Angle+: 90
Angle-: 90
The turtle method consists in (thank Marylin for the picture) visualizing the rules as:

Cool!
And with the Turtle I can introduce something new. It’s called [ for “push” and ] for “pop”. Basically, this new symbol in the grammar what it does is to remenber a position and to recall it. See in this example how it works.

Can you see the difference? In the bottom example C is related to B, while in the first case C is related to A becase we push [ after A and we pop it again before C. This method works as a LIFO (Last In, First Out) what it means is that if you open several [ at the same time, the first time you close one of them with ] the one which is going to be used is the last one you open.
Ok ok, what else? Well, we can now try using several rules. Using several rules is very easy, you just substitute each rule on to the others until you get everything susbtituted.
For example if you go back to the Koch curve.
Axiom:
  F
Rules:
  F=F+F--F+F;
Angle+: 60
Angle-: 60
You can rewrite it using three rules as this:
Axiom:
  F
Rules:
  F=SAS;
  A=+F--F+;
  S=F;
Angle+: 60
Angle-: 60
The reason for using 3 rules is:
F–>SAS–>F+F–F+F–>SAS+SAS–SAS+SAS
Suppouse we use 2 rules as this:
Axiom:
  F
Rules:
  F=FAF;
  A=+F--F+;
Angle+: 60
Angle-: 60
Then we will have:
F–>FAF–>FAF+F–F+FAF
And you can see the structure changes, because we have to susbstitute rules over what we have and it changes depending on the rules… So it’s a little bit tricky.
I suppose now you want to try some of these things yourself. So it’s InkScape time.

Basically, InkScape it’s superpowered Paint. With some advantages. It’s free and Open Source (you can download it use it and change code as you wish). Can do vector grpahics (when changing the size of things pixels don’t get bigger, it uses vectors to set the positions of things). Can link things and write scripts (if you move things inside a graph, labels and arrows will move to fit the new disposition). Uses a standard kind of files to save your drawings (you can easily import and export files). Can open pdf files and extract parts of them (depending on the pdf you will also be able to edit the pictures and it will recognize different parts on them allowing you to edit them as they were generated by you). It’s available for Windows, Mac and Linux (If you use diferent equips, you can have the same program in all of them). And at last… has an extention to work with L-Systems.
To get this program, just go to their download section and look for the one that fits your system.
Once you have it installed, it’s very easy to generate L-Systems (a few years ago they only way of doing them was to program it yourself, so this is a great tool).
To generate a L-System, inkscape has by default an extension. Extensions>Render>L-System.

A options window will apear allowing you to play with the Axioms and Rules we have discussed before. One extra thing is that Inkscape has two kinds of variables for rules, the ones that draw something and the ones that are only used for displacement. For example, this is the setup for the Koch Island.
Axiom:
  -F--F--F
Rules:
  F=F+F--F+F;
Angle: 60

Hmmm very funny, but get into serious business… Want to impress someone? Try the Dragon curve! (Thanks Penguin Pete for the reference).
Axiom:
  FX
Rules:
  X=X+YF;
  Y=FX-Y;
Angle: 90

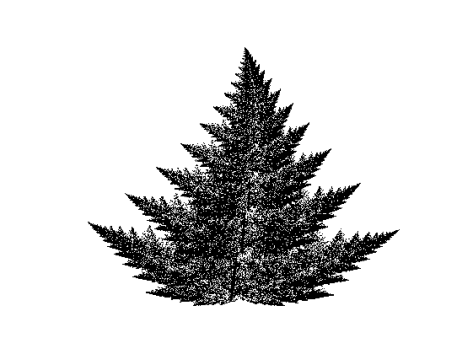
And of course some clasical trees will look very nice. If you randomize step and angle, each iteration will be a small change in the angle and in the longitude of the step. In this case, that will give a more realistic appearance to trees.
Axiom:
  F
Rules:
  F=F[+F][-F];
Randomize Step (%):20
Angle: 20
Randomize Angle (%):20

That remembered me an applet I did last summer as a gift. You can check my random Forest in Openprocesing (click on canvas an a new one will appear).

Until now, we have deal with systems where there is no overlap, but if you allow it and actually, if you use it, things like this can emerge (Thanks to J C Lawrence).
Axiom:
  W
Rules:
  W=+++X--F--ZFX+;
  X=---W++F++YFW-;
  Y=+ZFX--F--Z+++;
  Z=-YFW++F++Y---;
Angle: 30

Ok, so now we arrive to Penrose P3. (Thanks to the people in the Cornell college for a tutorial like this but maybe more complete and readable than this one).
Axiom:
  [N]++[N]++[N]++[N]++[N]
Rules:
  M=OA++pA----NA[-OA----MA]++;
  N=+OA--PA[---MA--NA]+;
  O=-MA++NA[+++OA++PA]-;
  P=--OA++++MA[+PA++++NA]--NA;
  A=
Angle:36

For more about Fractals, L-Systems and Strange Attractors, an easy introduction (this time in Spanish):
http://www.dmae.upm.es/cursofractales/
Hope you enjoy it!!
References:
L system definition.
http://en.wikipedia.org/wiki/L-system
Koch Snowflake.
http://en.wikipedia.org/wiki/Koch_snowflake
Cesàro Fractal.
http://mathworld.wolfram.com/CesaroFractal.html
Turtle picture.
http://briefinsights.blogspot.co.uk/2011/02/inkscape-l-system-turtle.html
InkScape
http://inkscape.org/index.php?lang=en
Dragon Curve
http://en.wikipedia.org/wiki/Dragon_curve
Penguin Pete. Dragon Curve and several L-Systems in Inkscape.
http://penguinpetes.com/b2evo/index.php?p=694
Some L-System Examples and a Penrose Tiling.
Penrose Tilling.
http://es.wikipedia.org/wiki/Teselaci%C3%B3n_de_Penrose
Cornell College.
http://people.cornellcollege.edu/dsherman/inkscape-fractal.html
Randomize Angle (%):20
Fra

How to: Animated Desktop or Webpage as a Background.
In this post I’m going to share a nice tutorial for Windows XP (don’t know if it works also on different versions, please, give feedback if you try).
So…
How put a webpage as desktop background.
Step 1. Select your web page and copy it’s link. In this case for example, we want to set thebrickinthesky as background, so copy this link: https://thebrickinthesky.wordpress.com/
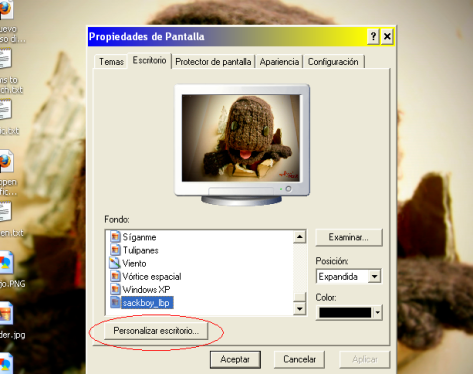
Step 2. Go to your desktop (here is mine). And right click >Properties.
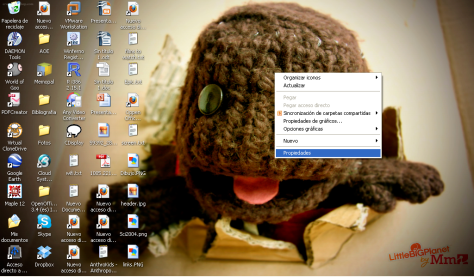
Step 3. Inside properties, go to Desktop>Personalize Desktop (see figure).
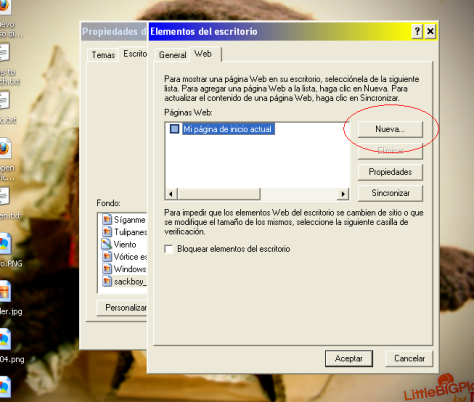
Step 4. Inside Personalize Desktop go to >Web and… >Add New.
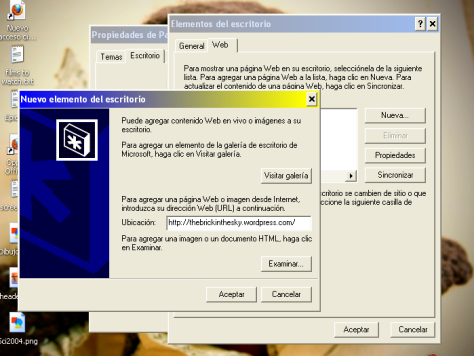
Step 5. In the new menu window just paste the link to the web page and click accept. (Later we can change the configuration, now just accept everything and see how it looks).
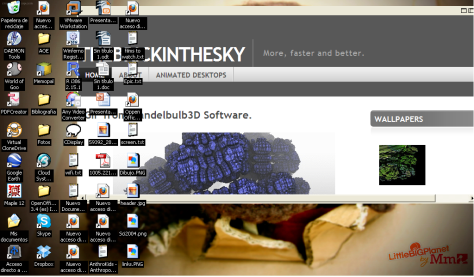
Step 6. Voilá! Here is the webpage as a background. You can change it’s size, interact with it or even close it. (When you go to the top border, some buttons appear and allow you configure things).
And now that you know that… Use it.
Here is an example.
How to set up an animated desktop background.
In this example we are going to use a GIF image to generate an animated background. (You have many GIF in this blog, but for the example I’m going to use a GIF from the blog of a friend: Anahís XX).
Step 1. Download a GIF somewhere. In my case, I go to Anahís XX and I took this GIF (right click on it and save as):
Step 2. Look in your computer for the GIF where you downloaded it and open it with right click>Open With>Internet Explorer. (You need to use internet Explorer because is that browser which Windows is going to use in the desktop, so If the gift doesn’t show in internet explorer, it will not work on your desktop). Copy the path to the GIF.
Step 3. Go to your desktop (here is mine). And right click >Properties.

Step 4. Inside properties, go to Desktop>Personalize Desktop (see figure).

Step 5. Inside personalize Desktop go to >Web and… >Add New.

Step 6. In the new menu window just paste the path to the GIF file and click accept.

Step 7. Et danse tout le monde! (As in the other example, you can change many properties).
Remember that my notebook doesn’t have graphic card, so the final result will be better in other computers.
As final part of this post, a new section will be now available “Animated Desktops”, where new GIFs will be posted to allow you to download them. Please, if you find this useful, reblog. Thanks!! =^_^=
