Today I bring 2 projects. The first of them is called Linkio. It is a set of intelligent plugs that can be accessed through your phone allowing you to connect/disconnect electric equipment. To be honest, this is just an example of The-internet-of-things. Eventually, all our equipment will be accessible on-line through the mobile phones and it will be possible to turn it on/off… but that day has not arrive yet… so that is why Linkio is relevant now.
You might notice that Linkio is already fully funded… I just share it because it is interesting.
The other one is Pi Watch. It is a smart, tactile, watch built with the Teensy board. Teensy is a microcontroler with a board which is software compatible with Arduino (it can be programmed with the same code). I think that as it is has not many uses… but it can be modified for other purposes…
Generally, I prefer to do tutorials about open hardware and software, but this one is different. The number of people using LabView and Arduino is so big that it starts to be interesting being able to use both together.
0 Step. You have a copy of Labview 2013 or newer version installed.
1 Step. Install Arduino Toolkit in Labview. To do that, we can simply follow the indications from National Instruments listed here.
2 Step. Install VI Package Manager (VIPM) from it’s webpage. Simply follow the installing default steps. This software will help you manage different toolkits for LabView.
3 Step. Run VIPM. Since it is the first time, it will take a while to detect all the packages from Internet. Once it is finished, look for the LabView to Arduino and click Install.
simply follow the steps and it will be installed without any problem.
4 Step. Connect your Arduino to the USB port. If you don’t have it yet, at this point you need to have installed the Arduino IDE and drivers.
5 Step. Upload into the Arduino board the new firmware that will allow it to communicate with LabView. (NI tutorial here). The file you need to load into the Arduino will be in a folder created when you installed the Arduino-LabView toolbox. Open and browse to LIFA_Base.ino found in C:\Program Files\National Instruments\LabVIEW 201x\vi.lib\LabVIEW Interface for Arduino\Firmware\LIFA_Base
Make sure you select the UNO board and the correct COM port.
Now the Arduino is ready to comunicate with LabView and Labview has the palette with VIs to send and read instruction from the Arduino. Let’s do something.
5 Step. Start LabView and open a new VI.
You will notice now that in the block diagram view, there is an Arduino palette.
6 Step. Drag and drop Init and Close. This will be necessary to initialize the communication and VERY IMPORTANT to close the port once we finish using it.
7 Step. Add a constant for the “Bits Per Packet” input of the Init (Right click Create>Constant), and add controls for the rest of them (Right click Create>Constant). Remember to arrange them in the Front Panel.
8 Step. Now create a while loop (Remember to create a buttom to stop the loop). This loop will run continuously taking values from the Arduino. (I also placed an indicator on the Error Output of the Close VI).
Inside the loop we put the Low Level “Analog Read Pin” and a waveform chart. Edit the properties of the waveform as you prefer. In my case, I remove the autosizing of both x and y axis.
9 Step. You might notice the constant “0” attached to the read VI, it indicates we are using pin A0. Next step is to connect something into the pin A0 that generates a voltage. In our case we can use the photodiode from the last tutorial (one pin to A0 another one to GND).
10 Step. Now everything is ready to run. Make sure you select the correct board, the baudrate and the correct COM port (you can check in the Arduino IDE if you don’t know the port). And Voilá!
Today I bring you a project that is already funded but is not yet finished, so you have the opportunity to participate. Also, it is about 3D printing, which I like quite a lot.
Also, because it is already funded, we can add it to our previous graph and see if it fits the pattern.
In order to display all the projects in the same scale, we are going to scale the possible pledged amount to 1 and put the number of bakers in percentage. The result is…
Up to now, all the funded projects follow a very similar profile! Which by the way is quite similar to the red continuous line… which is the Poisson distribution (scaled). Which by the way could suggests that there is no snowball effect (successful projects become even more successful). And in principle could explain also the fail of tweeq, it basically means that tweeq didn’t offer enough low money pledge options.
In principle it starts to make sense… and becoming interesting. Probably the next step will be calculating the number of people who just put money and didn’t want anything in exchange. Or how close where the pledge options.
The Kickstarter project of this week comes with bad and good news. The bad one is that tweeq is not going to be funded. On the other side, StickyBits still pledging for money and it’s still increasing the funding, so maybe they reach the goal. Just to mention, StickyBits is missing updates, for example it doesn’t say “featured in” as others do after they where featured in blogs. Many blogs (like the brickinthesky), will feel better doing publicity if the project acknowledge them, so remember, a source of publicity is important.
Now, what was wrong with tweeq? In my opinion, it was not clear what was the product and what will the backers get for their money. If you look at the different options, it’s actually very difficult to compare them and get a clear idea if you want to spend more or less money…. Compare the backing profile for mangocube who was funded, and tweeq which failed.
The product they try to develop is quite similar… but the funding profiles are the opposite!!!
Anyway, information is not enough to assure that was the reason, but have it in mind for next projects and if we see similar profiles, then it will become clear.
The project for this week is… iSmile Basically, a bluethooth remote for your phone to take selfies.
Today we have a new KickStarter projects. But first, review the one from last week. It was the Packed Pixels, and it looks like it is going to be funded. What is the key features of this project that makes it become funded? From our last analysis we found that 3 main reasons:
Bakers will get a free sample of the product.
Project has a good video.
This is another step of the project, not the main step.
Those reasons are also present in this project, and reviewing both projects, I can add another 2:
Worldwide free shipping.
Good visual description of many different uses and applications.
Actually, Packed pixels is on Kickstarter for second time. The first time didn’t manage to get funded. They asked for £ 165000 and only get £47000. Now they added video, images and description of many different ways of using the product.
So, What project I promote this week? It is called tweeq and is a smaller version of Arduino (and Arduino compatible as well). Ideal for many projects and specially for wearables.
This small project will help me later when I introduce a Matlab script I’m preparing, so stay tuned to the blog!
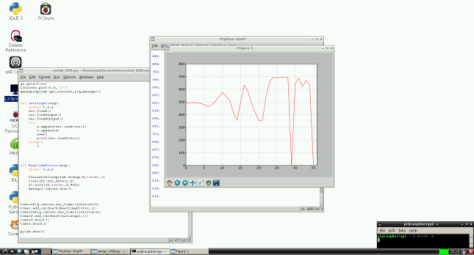
Today I’m going to do a simple example of data logging with Python and Arduino (my old Duemilanove). The Arduino is going to read a signal from a sensor and is going to report that value through the serial port. The Python script is going to scan the port from time to time and get the latest value. It’s not a clean implementation and can be improved, but it is an easy example.
Step 1. As a sensor I’m going to use a photodiode. Basically a photodiode works absorbing light and turning it into a voltage. To find out which terminal is the positive, simple connect the photodiode to a voltmeter and apply some light.
This model in particular is not very good for visible light (usually these models are designed to work at certain ranges, so maybe this one has its maximum sensitivity at IR or UV), but it will work.
Attach the photodiode between ground pin (GND) and Analog Input A0.
In this way we are going to read the voltage generated by the photodyode and detect the amount of ligth in the room.
Step 2. Program the Arduino to read an analog input and write the value to the serial port. We already did it in the post (Raspberry Pi 001: Setup and Run first Arduino-Python project). But just in case, this is a simple program that reads pin A0 and writes the value (in volts) to the serial port.
int sensorPin = A0;    // select the input pin for the photodiode
int sensorValue = 0;  // variable to store the value coming from the sensor

void setup() {
Serial.begin(9600);// initialize serial communications at 9600 bps:
}

void loop() {
sensorValue = analogRead(sensorPin);  // read the value from the sensor:
// Convert value to volts and print the results to the serial monitor with 4 digits precision:
Serial.println(sensorValue*(5.00/1023.0),4);
delay(20);   // stop the program for for 20 milliseconds:
}
Upload the program to the Arduino and you will be ready. Just in case, check the serial monitor to see that the Arduino is sending the values and simply putting your hand over the sensor test if the values change.
Step 3. Write a Python code that reads the serial port, gets the last value and stores it.
import csv
import serial
import time

#First we create a name for the CSV file that is going to be date and time
name=time.strftime("%Y_%m_%d_%H_%M_%S", time.gmtime())
#Open the file
f=open(name+'.csv', 'wt');
#Initialize the CSV writer to write data into file
writer = csv.writer(f,delimiter='\t')

#Now we write a few lines to swhow how to write data
writer.writerow(['[Header]'])
date=time.strftime("%Y-%m-%d %H:%M:%S", time.gmtime())
writer.writerow(['date='+date])
writer.writerow(['Column1=Time'])
writer.writerow(['Column2=Voltage'])
writer.writerow(['[Data]'])

#Open the serial port. From the Arduino program we know the Arduino is in com3,
#and we selected 9600 as baudrate
ser = serial.Serial('com3',9600,timeout=1)

#For some reason, when the serial port is initialized,
#its first value is not real, so just read it and discard
kk=ser.readline();

#We are going to take 250 data points
for t in range(250):
    #Read last string from serial port
    kk=ser.readline()
    #String is in the form <value>\r\n we only need the <value>
    kk2=kk.split('\r',1)
    s=kk2[0]
    #We put each data point in a new row of the data file.
    writer.writerow((t*10,s))
    #waits 10 seconds for next data point
    time.sleep(10)

#When finish, close the file and the serial port.
f.close();
ser.close();
When we run this script it generates a data file that looks like this:
Now you can import the data into any program you like, for instance Open Office Calc.
Hope you find this interesting. Now you can try things like reading humidity sensor for a week, or saving home temperature, or any other idea you get.
Today I start a new section where I’m going to put the most interesting KickStarter project of the week. Maybe you agree, maybe you have a better one (share!). For me, this week it is the MangoCube.
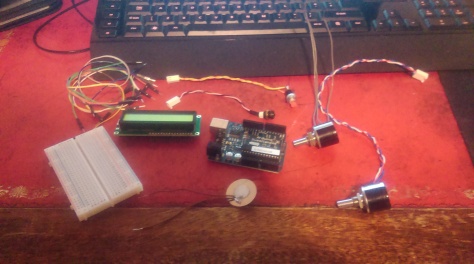
I was back at my home for a week and I decided to bring back a few things… Among them there is an Arduino Duemilanove, some breadboards and an LCD display (MD216-01 Rev.A 16 characters 2 lines). All bougth long back at BricoGeek.
So I decided it is a good idea to build a small project. I’m going to build a start/stop timer.
But before, do you remember my other posts about Arduino?
Hope you like them. Now for the timer. This is my list of components:
Arduino Duemilanove
LCD (taken from old equipment)
Button (taken from old equipment)
LED (taken from old equipment)
2x Variable resistor (taken from old equipment)
Breadboard
Connectors
Piezo speaker (taken from a Christmas card)
I couldn’t find any more the spreadsheet for my particular LCD, but I found a good tutorial here (The only difference is in the pins for the back-light).
1. Because I want to be able to use the Arduino and don’t destroy this project, the first step is to build a buffer in the breadboard. We connect Gnd and 5V from the Arduino to the breadboard, and Arduino digital pins from 5 to 7 to the corresponding pins in the breadboard. In this way we can remove the Arduino and know exactly which pins we need to connect again.
2. Connect LCD in the left hand side as shown. Pins will go from 1 to 16 in this model.
To understand what pins do, we have this nice video.
3. Connect pins!
LCD –> Arduino
1 — Gnd
2 — +5V
3 — Middle pot of a variable resistor between +5V and Gnd
4 — 7
5 — Gnd
6 — 8
11 — 9
12 — 10
13 — 11
14 — 12
15 — Gnd
16 — Middle pot of a variable resistor between +5V and Gnd
The variable resistors will control the back ligth and the contrast. Once it is set you can read their value and replace them with standard resistors.
Now connect the piezo to Gnd and Pin 6 of the Arduino. Connect the LED to Gnd and Pin 5.
For the button, connect one side to Gnd and the other side will be connected to a resistor that goes to +5V and a capacitor that goes to Pin 4. The final result is something as messy as this:
4. Now your LCD screen is connected to the Arduino, time to check it. To do that load an example File>Examples>LiquidCrystal>HelloWorld
Before running this example you need to define which are the pins. In our case it has to be:
LiquidCrystal lcd(7,8,9,10,11,12);
Now you can compile and upload the code:
5. Let’s now modify this to show a proper clock counter and make Arduino to read the button to reset the counter. We start with the code for the HelloWorld and tweak it a little bit:
#include "pitches.h" //For playing a note with the piezo
#include <LiquidCrystal.h> //Libraries for the LCD
LiquidCrystal lcd(7,8,9,10,11,12); //Defiying the pins in the LCD
int notes[] = {
NOTE_A4, NOTE_B4,NOTE_C3 }; //3 notes
const int buttonPin = 4; // the number of the pushbutton pin
const int ledPin = 5; // the number of the LED pin
const int piezoPin = 6; // the number of the piezo pin
int buttonState = 0; // variable for reading the pushbutton status
int counter = 0;
int hours = 0;
int minutes = 0;
int seconds = 0;
void setup() {
// set up the LCD's number of columns and rows:
lcd.begin(16, 2);
// initialize the LED pin as an output:
pinMode(ledPin, OUTPUT);
// initialize the pushbutton pin as an input:
pinMode(buttonPin, INPUT);
// initialize the piezo pin as an output:
pinMode(piezoPin, OUTPUT);
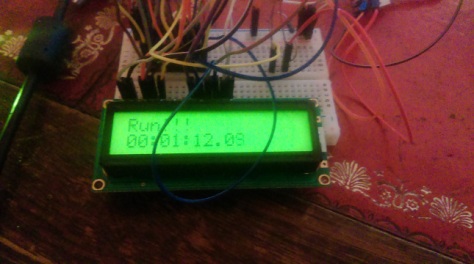
// Writte in the LCD symbols that will not change
lcd.print("Run!!!");
lcd.setCursor(2, 1);
lcd.print(":");
lcd.setCursor(5, 1);
lcd.print(":");
lcd.setCursor(8, 1);
lcd.print(".");
}
void loop(){
//Now while the button is unpressed the counter will tick
while (digitalRead(buttonPin)== HIGH){
digitalWrite(ledPin, HIGH);
noTone(piezoPin);
delay(100); //wait for 100 ms
counter = counter +100;
//This is for setting the counters into the next multiple
if (counter>= 1000){
seconds=seconds++;
counter=0;
}
else{}
if (seconds>= 60){
minutes=minutes++;
seconds=0;
}
else{}
if (minutes>= 60){
hours=hours++;
minutes=0;
}
else{}
//Now this code is for writting the time
//We want to have zeros before numbers
if(hours>9){
lcd.setCursor(0, 1);
}
else{
lcd.setCursor(0, 1);
lcd.print(0);
lcd.setCursor(1, 1);
}
// print the number of hours since reset:
lcd.print(hours);
if(minutes>9){
lcd.setCursor(3, 1);
}
else{
lcd.setCursor(3, 1);
lcd.print(0);
lcd.setCursor(4, 1);
}
// print the number of minutes since reset:
lcd.print(minutes);
if(seconds>9){
lcd.setCursor(6, 1);
}
else{
lcd.setCursor(6, 1);
lcd.print(0);
lcd.setCursor(7, 1);
}
// print the number of seconds since reset:
lcd.print(seconds);
if(counter/100>9){
lcd.setCursor(9, 1);
}
else{
lcd.setCursor(9, 1);
lcd.print(0);
lcd.setCursor(10, 1);
}
// print the number of seconds since reset:
lcd.print(counter/10);
}
//When we press the button the LED will be off and the counter reset
// turn LED off:
digitalWrite(ledPin, LOW);
tone(piezoPin, notes[1],20);
counter =0;
seconds =0;
minutes=0;
hours=0;
}
NOTE: Sometimes the command
#include "pitches.h"
doesn’t work properly and you need to load and compile the example File>Examples>Digital>toneMelody
I have been on holidays, but it has been a few weeks now since I received a few new gadgets… and it’s time to write about it. (Remember the previous post about Raspberry Pi?)
In order to take screenshots we need to install the utility scrot. To do that, open a LXTerminal and type:
sudo apt-get install scrot
To use it after 10 seconds delay:
sudo scrot -d10
and the capture will be saved in a file with the numerical date and time with .png extension.
To display a list of Scrot comands:
sudo scrot -h
(It seems I already had it).
2 Running scripts on start up.
One of the most useful things to do with the Pi is running scripts automatically on start up. That means that when the Pi starts, it will run whatever script you write, allowing you to program many tasks.
The first thing to notice is that your Pi can start on graphic mode (GUI), or in the command shell (Non GUI), and there is things that can only be done in the GUI (e.g. like plotting a graph) and others that can be done in the Non GUI (e.g. change keyboard language).
GUI
First we create a simple Python script that plots the sine() graph from 0 to pi. It is going to be called graf.py.
from math import pi
import numpy as np
import matplotlib.pyplot as plt
fig=plt.figure()
x=[i / 100.*2*pi for i in range(100)]
y=np.sin(x)
plt.plot(x,y)
plt.show()
Then we need to edit the autostart file. This file has all the commands that are going to be run after the desktop is loaded.
sudo nano /etc/xdg/lxsession/LXDE/autostart
Once the editor is openned, we just add this line to the code:
@/usr/bin/python /home/pi/graf.py
In the next start up the script will run automatically and will show the sine plot.
This can be done for any Python script you want, and gives you lots of option to automatize things.
Non GUI
First we create a simple Python script that sums the first 100 integers and writes the result to a file. It is going to be called writenumber.py. The main thing to take into account now is that we need to specify the full path to files everywhere we use them, or the script will not work.
a=0
total=0
for b in range(100):
    a=a+1
    total=total+a

with open('/home/pi/test','w') as f:
    f.write(str(total))
If we try it, it will create a file called test.txt which has the total inside.
Once the script is working, we go to their file properties and enable “Make the file executable”. This will allow the command shell to run it.
Now to call this script on the start up, before the GUI interface appears (or if we work completely on shell mode without graphical interface), we write on a LXTerminal:
We save the file and restart… (remember to erase the previous made test.txt file)…. and voilà!
The script is executed on the start up and a new test.txt file is being created.
3 Remote desktop connection through xrdp.
The complete post on how to do it is here. But the steps are very easy.
Open a LXTerminal and install xrdp
sudo apt-get install xrdp
and with a windows xp computer, simply go to the remote desktop ant type the IP of the Pi (e.g. you can run the Pi with a screen once and see the IP).
The xrdp login windows appear.
Here it is the Pi with the WiFi on it and power… and the remote desktop from my laptop.
4 Installing the Raspberry Pi Camera.
And now, at last, for the Pi Camera. It is really easy to install it. Just open the Raspberry and plug the wire.
In one position will not make any contact at all, so don’t worry. (In the video they have the regular Pi, mine was mod with heat-sinks).
Remember to pass the wire through the case before connecting it.
Ok, so now it is connected. Is it ready to go? Not yet. We need to enable it. For that, we just follow the tutorial on the official webpage. which I copy here.
Start the Pi and open a LXTerminal to update.
sudo apt-get update
sudo apt-get upgrade
Acces the configuration settings and enable the camera.
sudo raspi-config
and navigate to “camera” and select “enable”
Then finish and reboot.
Now to take a simple image… open a LXTerminal and run
raspistill -o image.jpg
It will be saved on the main folder.
To see the rest of commands (including streaming), visit the official webpage.
5 Installing PiCamera library on Python.
Ok ok, now for fun. Pi camera and Python, the picamera module!
But before, remember the previous posts on Python:
Ok, so, we want to make the camera work alone and being able to see remotely what is being recorded. How to do it?
First, get the libraries for using the camera on Python (thanks to Dave Jones for them).
apt-get update
apt-get install python3-picamera
or
apt-get install python3-picamera
Once it is installed, we only need to go to Python and use some of the picamera codes. You can find the documentation here.
For this post, I will use the script for saving pictures every 10 seconds. Basically, this scripts initialices the camera, adjust the resolution, the rotation, and take some pictures.
import picamera
from time import sleep

camera = picamera.PiCamera()
camera.resolution=(1024,768)
camera.rotation=180
camera.start_preview()
for i in range(4) :
    camera.capture(str(i)+'.jpg')
    sleep(10)
And voila!
For now is quite a lot. I will come back with the Picamera later in another projects, but for now I think this is quite useful.


![IMAG3964[1]](https://thebrickinthesky.files.wordpress.com/2014/08/imag39641.jpg?w=474&h=264)
![IMAG3965[1]](https://thebrickinthesky.files.wordpress.com/2014/08/imag39651.jpg?w=474&h=264)
![IMAG3966[1]](https://thebrickinthesky.files.wordpress.com/2014/08/imag39661.jpg?w=474&h=264)
![IMAG3967[1]](https://thebrickinthesky.files.wordpress.com/2014/08/imag39671.jpg?w=474&h=264)
![IMAG3969[1]](https://thebrickinthesky.files.wordpress.com/2014/08/imag39691.jpg?w=474&h=264)